Tuesday, December 30, 2008
UYG Virtual bank
After being beaten up on several fronts, once wonders what to do if the job situation sucks & if the investment environment is messed up. Add to that, the money offered in the bank CDs, which are now supposedly safe upto 250K, is not much. Bank CDs now give anywhere from 2.5 to 4% maximum. Majority of the so called investment analysts & advisors got us nowhere anyways, so let us fire them & take charge of our portfolios.
So how do we generate income. Introducing the UYG virtual bank.
So how about analyzing UYG as if you are putting money in the bank as a CD. Analyze the scenario that if someone takes 100K & invests in UYG & sets up a revolving covered call selling approach.
UYG is an ETF, beaten down, & with the money being pumped into the system & by the government, the lower side potential is marginal, though it may stay flat between 4 to 7 dollars.
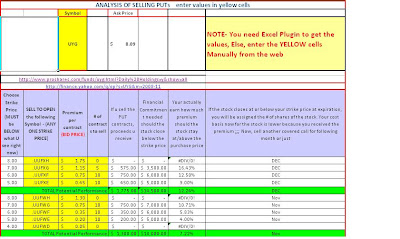
Refer to the screen capture for reference, it give a better idea. This is from a spreadsheet that analyses several scenarios.
One can either invest into only one position or a few or all.
The nice thing is that it shows the return based on per month & using other approaches for 3 months versus upto a year. One can choose a strategy that is suitable to make choices based on the average maximum return based on a monthly basis if a strike price is not reached, versus if it is reached.
What is the worst case scenario? Will UYG ETF go to zero ? I hope you respond No! ; Then the worst case scenario is that UYG goes nowhere or goes down. Okay, in that case wait & then invest into selling covered calls at a future date once again. In the meantime, the cost of stocks one invested into went down already (refer to the extreme right side column).
If one invests 100K or so in a bank CD, the money we get here upfront is equivalent of renewing that CD for several additional years.
..................
Monday, December 22, 2008
UYG and S&P for Dec 23
UYG came down to nearly 5.25 & then bounced back to close at 5.42
For scalpers, it may be worth watching its behavior.
If it pulls back to around 4.9, it is an opportunity for entering.
The trigger can be pulled to offload around 5.6
........
SPY showed very strong support at 85.5. It has small support at 88.40
In overnight market, the (ESH9) Emini futures for S&P are moving sideways.
The overall long term trend for S&P has been downwards.
If it moves upwards, then anaylyze the charts that indicate SPY to go till 87.5 or ESH9 till 877.
On the downside, we may see a ride for SPY till 85 or ESH9 till 855
The behavior indicates that will definitely come down to retest the 85.5 (SPY) or 855 (ESH9) in near term.
.........
Thursday, November 13, 2008
Analyze Selling Dec PUTs
Analyze the risk & reward for following December PUTs.
EEM:
Sell to Open Put -MBYXR DEC 18
Limit at $1.15
Return=1.15/18
KOL:
Sell to Open Put -QLEXL-PUT DEC 12
Limit at $0.90
Return= 0.9/12
UWM:
Sell to Open Put -ULXXO DEC 15
Limit at $1.55
Return=1.55/15
.............................
EEM:
Sell to Open Put -MBYXR DEC 18
Limit at $1.15
Return=1.15/18
KOL:
Sell to Open Put -QLEXL-PUT DEC 12
Limit at $0.90
Return= 0.9/12
UWM:
Sell to Open Put -ULXXO DEC 15
Limit at $1.55
Return=1.55/15
.............................
Wednesday, November 12, 2008
Got UYG ?
Got UYG ? Well, the financial ETF may be good at this price if you analyse selling a covered call.
Analyse the following:
One & a half week for November expiration on Nov 21.
If one sells the call for strike price 7 call & earn a premium of .70, it is a 10% return for 10 days.
......
For December expiration on Dec 19.
If one sells the call for strike price 7 call & earn a premium of 1.25, it is a 17% return for 5 weeks.
............................
Saturday, October 25, 2008
UYG - Selling PUTS - Nov Dec
Here, we discuss examples of selling PUTs. Take a look at the captured image from the spreadsheet that was used to perform the analysis. You can try something along these lines for various equities.
Analyse how one can generate an income for November / December for UYG in this example for various positions. For the conservative trader, the lower values sold are the best. For those who beleive that ultimately a stock will go up, they can use this to own the stock at a lower price.
Here is a brief tutorial on how selling PUTs works (this has been discussed previously on my blog; as well as several sources exist on the web).
---- Selling PUTs can be applied to either earn premium if Strike Price (SP) is not reached [Implying that the stock will not go down too much], or if a trader won't mind to buy a stock at a lower price. Of course, margin requirements have to be met with the brokerage firm so as to fulfill the obligation should a stock go down & hit the SP.
The obligation that a trader has is that if the stock closes at that strike price (SP) at expiration, the trader will buy the stock.
This is considered as a way to earn premium if it does not reach the SP, or a way to get a stock at a cheaper price because trader has pocketed the premium in advance.
If SP is not reached, trader keeps the premium. The premium received divided by the obligation to purchase is the ROI.
If SP is reached, then:
- The trader owns the stock at a lower price than SP, & can hold on to the stock or can turn around & sell a covered call against the holding.
- Or, if the trader does not want to own the stock & wants to bail out & not purchase the stock, then a reverse order needs to be executed to "buy back" (Buy to Close) the PUT & incur some loss/profit.
Position can be closed at a profit (if stock goes up, PUT loses value) or loss ( if stock goes down, PUT gains value) even prior to reaching the SP by simply buying back the PUTs
...................................................
Wednesday, October 22, 2008
PUTs - at near bottom amidst the turmoil
Perform an analysis of the following whereby if one sells PUTs for November or December, what is the ROI should the equity stay above the Strike price.
The calculations should indicate a return of 6% to 10% before commissions.
November - WNR ; Strike price = 5 , premium recd. = .45
November -UYG ; Strike price = 8 , premium recd. = .50
November -TIE ; Strike price = 7.5 , premium recd. = .75
December - UYG ; Strike price = 6 , premium recd. = .60
Of course, the investor will be assigned the stock should the equity drop & close at or below the strike price. In that event, either one can hold the position at a lower cost to sell it or sell a covered call against it in future. Other option include closing the position prior to expiration.
Look at the 52 week & 2 yr & 5 yr lows on the stocks, and perform the overall analysis.
.................................................
Sunday, October 12, 2008
Still on board the wrecked ship ?
Well, the current turmoil hit all sectors & at a global level.
It is an interesting case study to see how we live in a global economy that even fraud & bad moves in one sector in a country can cause turmoil all over triggering such an overeaction.
Yes, "cash is king" right now for those who were in that position & now can start picking up in nibbles.
It also appears to be a 'once in a lifetime opportunity" to pick up financial ETFs.
The thought that always crosses the mind now is that you can fire the analysts (as always,.... though they do influence the ups-n-down in short run) ; throw the technicals out of the door (they have no meaning right now in this market), & perform your analysis on fundamentally strong companies & ETFs.
This oversold scenario after hitting quite hard has made UYG, SSO, DDM, UWM, UNG, EWH, EWZ as very attractive ETFs.
Along the same lines, equities such as C, GE, INTC, MSFT, TSO, PCU, FCX, FLR, KFT, TXN, MOT, ISRG, BA, MCK, STJ, SYK, .... (we can go on & on).
So analyse a few scenarios where you can buy some strong positions & then sell covered calls against them, for example UYG below 10 is great with a covered call for November yielding an execellent return or selling a PUT for November strike price of 9.
Alos, analyse simply buying LEAPS for strong companies, (for example Jan 2011 call for INTC strike of 15 )and then wait for some upward movements to sell a call against such positions.
Now of course, many though that we had hit the bottom couple months ago, & were wrong. but right now, it seems we may be there.
...............
Saturday, September 27, 2008
Few more Nov Covered Calls for analysis
Three more months to end this year. Time flew by too fast.
Anyways, these are some of the November covered calls (expiration is Nov 21) that may be worth analyzing. Plug & analyse these into the spreadsheet for covered calls.
........ The Following are ETFs ....................
UYG is at 20.4 ; Sell Nov Call Strike Price = 18 ; Premium= 4.50; Return before comm= 14%
UYG is at 20.4 ; Sell Nov Call Strike Price = 17 ; Premium= 5.10; Return before comm= 12%
QLD is at 58.80 ; Sell Nov Call Strike Price = 58 ;Premium= 5.90; Return before comm= 9.6%
DDM is at 57.04 ; Sell Nov Call Strike Price = 56 ;Premium= 5.3 ; Return before comm= 8.2%
UWM is at 48.05 ; Sell Nov Call Strike Price = 44 ;Premium= 7.2 ; Return before comm= 7.7%
UNG is at 34.02 ; Sell Nov Call Strike Price = 33 ;Premium= 3.30 ; Return before comm= 7.4%
SSO is at 54 ; Sell Nov Call Strike Price = 51 ;Premium= 6.40 ; Return before comm= 7.2 %
........ The Following are Stocks ....................
FTO is at 20.67 ; Sell Nov Call Strike Price = 20 ;Premium= 5.3 ; Return before comm= 10.5%
AIG is at 3.15 ; Sell Nov Call Strike Price = 3 ;Premium= 1.15; Return before comm=50%
LCC is at 6.15 ; Sell Nov Call Strike Price = 5 ; Premium= 2.05; Return before comm=22%
DAL is at 7.95 ; Sell Nov Call Strike Price = 7.5 ; Premium= 1.80 ; Return before comm=22%
NT is at 2.55 ; Sell Nov Call Strike Price = 2.5 ; Premium= 0.60; Return before comm= 16.7%
GM is at 9.76 ; Sell Nov Call Strike Price = 9 ; Premium= 2 ; Return before comm= 16%
AMD is at 5.16 ; Sell Nov Call Strike Price = 5 ; Premium= 0.62; Return before comm= 16%
TSN is at 12.69 ; Sell Nov Call Strike Price = 12.5 ; Premium= 1.55; Return before comm= 12%
.........................................
Wednesday, September 24, 2008
Few Nov Covered Calls
Tuesday, September 23, 2008
Oct CALLs n PUTs
Analyze & calculate the returns for following October covered calls. Strike prices (SP) are mentioned based on the current closing price as of Sept 23.
DDM -SP=55 or 54 ; GM -- SP= 11 ;QLD -- SP=58 ; FTO SP = 20 ; TSO SP= 20 ; DAL SP=10 ; UYG SP=20 ; FLR SP=57.5 ; AMD Sp=5 ; F SP=5 ; GM SP= 10 or 11 ; AIG SP=5 or 6 or 7
Analyze & calculate the returns on selling the following PUTs:
UYG : Sell Oct 16 or 17 PUT ;
AIG: Sell lOct 4 or 3 PUT
...................................
Wednesday, September 17, 2008
Selling Oct PUTs
<
Analyze the strategy of selling PUTs for October. When a PUT is sold, one has the obligation to buy the stock at the strike price should it close at or below the strike price on expiration. So for 10 contracts (1000 shares), one needs that amount set aside or the amount based on the margin requirements set forth by the brokerage in the event the PUT gets exercised at expiration. Or one can buy back the PUT (but to close) to simply close the position.
So assuming 10 contracts for the analysis, calculate the return with margin. Note that the screen capture shows the return without margin.
Also, investigate the probabilities for these positions.
........................................
Wednesday, September 10, 2008
Writing PUTs: AIG, DAL, MER
Perform an analysis of the following Sept PUTs so as to get an idea about this strategy to either earn premium if Strike Price (SP) is not reached, or if a trader won't mind to buy a stock at a lower price. Of course, margin requirements have to be met with the brokerage firm so as to fullfil the obligation should a stock go down & hit the SP.
Stock: DAL ; Sell to Open PUT for Sept; SP= 7.5 ; credit = 0.75
Stock: MER ; Sell to Open PUT for Sept; SP= 17.5 ; credit = 0.56
Stock: AIG ; Sell to Open PUT for Sept; SP= 15 ; credit = 1.18
The obligation that a trader has is that if the stock closes at that strike price (SP) at expiration, the trader will buy the stock.
This is considered as a way to earn premium if it does not reach the SP, or a way to get a stock at a cheaper price becuase trader has pocketed the premium in advance.
If SP is not reached, trader keeps the premium. The premium received divided by the obligation to purchase is the ROI.
If SP is reached, then:
- The trader owns the stock at a lower price than SP, & can hold on to the stock or can turn around & sell a covered call against the holding.
- Or, if the trader does not want to own the stock & wants to bail out & not purchase the stock, then a reverse order needs to be executed to "buy back" (Buy to Close) the PUT & incur some loss/profit.
Position can be closed at a profit (if stock goes up, PUT loses value) or loss ( if stock goes down, PUT gains value) even prior to reaching the SP by simply buying back the PUTs
......................
Friday, September 5, 2008
Sept 5 thoughts on a down day
Analyze
.... Covered calls ....
LCC, US AIRWAYS SEPT 7.50 ;
HANS , HANSEN NATURAL OCT 25 ;
AIG, OCT 21
TIE, Oct 12.5
.... Calls ....
Jan 2009 -- BA , the 65 Call , symbol BAAM position looks good. Once the strike issue gets resolved, & the tanker contract comes thru, it will be worth it.
.... Bull Put Spread ....
ICE - Sept Short 80 & Long on 75 for a 9-10% return
SPX - Sept Short 1190 & Long 1185 for a credit of .85 for 5 dollar margin (17% rtn)
.... Condor using 2 spreads ...
RUT , September -- Bear Call leg of Sell 750/ Buy 760 credit = .95 ; Bull Put leg of Sell 670/ Buy 660 for credit of 1.15 ; net credit of 2.1 for a margin of 2
.........................................................
Wednesday, September 3, 2008
Covered calls for analysis
Analyze the following October Covered Calls: AEO (SP=15) ; TIE (SP=12.5) ; SBUX (SP=15) ; HUM (SP=45) ; GM (SP=11) ; ; TSO (SP=20) ; BRCD (SP=7) ; INTC (SP=21) ; IBN (SP=30) ; HANS (SP=25) ; SBUX (SP=16).
Watch for reversal in - Oil, energies, airlines, steel, & financials.
....................
Watch for reversal in - Oil, energies, airlines, steel, & financials.
....................
Saturday, August 30, 2008
Sept - Oct Covered Calls
In a direction-less market driven by emotions, it is hard to take prudent steps whereby Calls purchased will deteriorate & not recover. So, it may be best to look for covered call strategies where equities may be at or near bottom and sell calls either near or ITM. Selling calls works in the favor of the trader where time works with them & the position sold will decay. If the equity appreciates & expires ITM, then the stock will get sold automatically at expiration to cover the short option position.
Analyze the following covered calls on paper/spreadsheet & calculate the return on investment. For ROI, calculate the minimum & maximum returns.
Majority of the strike prices here for analysis are ITM.
I) September Expiration : MBIA (SP=15) ; DAL (SP=7.5) ; AMR (SP=10) ; UNG (SP=36) ; & AIG (SP=21) this has taken a big beating over past few months; FED (SP=15).
Returns are decent whether one looks into the short term for Sept or a combination of well distributed positions for both Sept & Oct.
II) For October expiration: XLF(SP=21) ; UNH (SP=31) ; IBN (30 or 35) this is a great bank ; EEM (SP=40); TSO (SP=20) this is at the bottom ; VLO (SP=36); HON (SP=50) this is a stable company ; F (SP=5) Ford is too cheap to ignore;
You may also choose to analyze GM for both Sept or Oct. If you doubt F or GM, do some research. These companies are too big & own several product lines.
Watch JPM & MER for pull back.
........................
Tuesday, August 5, 2008
Post rally analysis
In general, a large upswing occurred on Tuesday. Whether it can be sustained will be a TBD. Expect a pull back due to FRE reporting losses. That may bring down FNM & various financials & make C, MER, WFC, WB, XLF attractive. Up one day, down the next.
Also, for August 6th -- Watch how the following perform so as to confirm an uptrend of staying above the recent trigger(s) of any of the recent corresponding 9 day or 22 day or 40 day SMA.
BA, WMI, UNH, CVH, PCP had one of the triggers.
WLT is yet to confirm its trigger, although volatility is very high. So analyze a vertical for same month or an Aug/Sept diagonal.
RIG announces earnings prior to market opening.
PSA is poised to make some moves prior to earnings on Aug 7th.
..................
Monday, August 4, 2008
Financials , Transport, Storage & Insurance
Analyze PSA: Earnings will be announced on Aug 7 after market close.
Buy Sept 75 & Sell Sept 85 Calls OR Buy a Sept 85 call for 3.9 or 4
Analyze JPM: Buy Dec 42.5 & Sell Sept 45 call for debit of 2.55
Analyze the following for returns-
MER BULL PUT SPREAD : SELL 22.5 & BUY 20 ; credit= .50 over 2.5 dollar spread for September
COVERED CALLS: (selling them for Sept)
Buy WFC at $30.5 ; Sell to Open Call STRIKE PRICE Of 31 -WFCIM at $2.10
Buy AET at $41.80 Sell to Open Call STRIKE PRICE Of 45 -AAFII at $.90
Buy UNP at $79.61 ; Sell to Open Call STRIKE PRICE Of 80 -UNPIP at $4.30
Buy XLF at $21.4 ; Sell to Open Call STRIKE PRICE Of 22 -XLFIV at $1.24
.................
Wednesday, July 30, 2008
JEC, ABT, FLR, RIG, PSA ... more - Watch n Analyze
CLF, V, SWN, and FSLR will hopefully have a nice ride. Will MA follow the same path of V , is to be determined. AET will announce its earnings too.
The following are some additional positions to monitor and analyze application of a few theories to see the performance.
...........
JEC: If it crosses above 82.95, its 40 days SMA , then analyze the following trade
CALLS - Buy Oct 80 & Sell Sept 85 ; OR BUY Sept 80 & Sell 85
...........
ABT : If it stays above 56.34, its 9 days SMA, then analyze the following trade
CALLS - Buy Sept 55 & Sell Sept 57.5
............
FLR : If it stays above 86.09, its 22 days SMA, then analyze the following trade
CALLS - Buy Sept 85 or Buy Oct ; do not sell anything yet.
It may pull back a bit bec it rallied too much recently. It is generally on steroids.
..........
RIG: It is approaching its 22 day SMA of 143.07 followed by 40 day SMA of 145.3
So watch this one.
.........
PSA : is already on the watch list from a previous posting.
.........
Analyze Additional August Covered Calls
Analyze the following covered calls that provide 7 to 10 % return for August expiration in 16 days.
The price may vary based on when one enters, but the return is still good.
............
Buy 1,000 Shares of AMR at $9.15
Sell to Open Call 10 Contracts of -AMRHL, Strike price = 10 for $1.15
............
Buy 500 Shares of MER at $25.9384
Sell to Open Call 5 Contracts of -MERHD, Strike price = 25 for $2.35
............
Buy 500 Shares of FNM at $11.90
Sell to Open Call 5 Contracts of -NJWHK , Strike price = 11 at $2.2
............
Buy 500 Shares of XLF at $21.2395
Sell to Open Call 5 Contracts of -XLFHU, Strike= 21 at $1.16
............
Buy 500 Shares of FRE at $8.489
Sell to Open Call 5 Contracts of -FREHL, Strike=9 at $0.88
............
Tuesday, July 29, 2008
V , FSLR , PSA , SBUX
One can analyze the verticals so as to reduce the cost & have a limited risk & limited income strategy.
Or, simply buy a Call; put a stop loss ; or sell a call later a position moves up.
Stop loss will be 1 or 1.5 dollar below the threshold values mentioned for each.
.........
V : Analyze CALLS if it stays above threshold 75.21 - Buy Sept 75 & Sell Sept 80
Earnings July 30, after market close for Visa
...........
FSLR : Analyze CALLS if it stays above threshold 270.1 - Buy Sept 270 & Sell Sept 280
Earnings July 30, after market close. This is a high flyer with high volatility, so doing a vertical preferred.
.........
PSA : Analyze CALLS if it stays above threshold 80.71 - Buy Sept 75 & Sell Sept 85
Earnings August 7, after market close [Wait for a Pull Back]
.........
SBUX : Analyze CALLS if it stays above threshold 14.81 - Buy Sept 15 & Sell Sept 17
Earnings July 30, after market close
Controversial, however with cutbacks announced & bad news already built in, this may move upwards.
.........
Friday, July 25, 2008
Some Changes n Updates
Analyze:
Will BIDU , MOS , GOOG & XOI be a good candidate for Straddle? These swing quite a bit. [ Buy a Put & a Call for Sept or Oct; slightly OTM and plot the curve ]
CALLS
SWN : Sept 32.5
V : Sept 70
CLF: Sept 95
AET: Sept 35
.........
PUTS
SBUX: Aug 15
MA: 260
MUR: 80
CMI: 67.5
.........
CLF broke thru its 22 & 50 day SMA, so change previous list to a Call for it or monitor it closely for changes
MET below its 22 SMA, so monitor for PUT position.
BTW: SBUX just went below its 200 SMA.
.........................................
Paper Trade These Thoughts
The above is the pricing of the stocks as of this morning. After monitoring it for an hour and confirming that the directional move is still upwards for Call or downwards for Puts, jot down on paper & see if the paper trade for these positions would be successful.
SWN, MET, NOV, VZ seem to have bounce back in the other direction & may confirm the suggested trend. Refer to a comment & nice reasoning posted by a reader on Visa in the previous post.
................
Thursday, July 24, 2008
Analyze for July 28-30 Earnings
Wednesday, July 23, 2008
July 24 Spreads
Investigate Financial Plays
Once the finance bill to help housing & foreclosing real estate industry passes in next few days thru the political pathway, it will be interesting to see the financial stocks move. For Thursday, there can be several strategies to consider for FNM, FRE, SLM, BAC, C, & of course XLF. Along with simply buying the stock, one can investigate buying Calls as well as Bull Put Spreads.
Note - SLM had earnings report on Wednesday, so it will be interesting to see how it moves on Thursday morning. A sell-off reaction, such as the one for FNM & FRE that occurred last week on their bad news is welcome so as to load it up.
...............
Note - SLM had earnings report on Wednesday, so it will be interesting to see how it moves on Thursday morning. A sell-off reaction, such as the one for FNM & FRE that occurred last week on their bad news is welcome so as to load it up.
...............
Status on analyzing pre-earnings game - July 23 closing
BIDU - (this will be painful) announced stellar earnings, so the PUT will go down south at open. A remedial step to analyze will be to either 1) Buy a call & sell the PUT 2) &/Or convert the PUT into a Bull Put Spread & Buy a Call at same time.
Other positions - we will know the picture prior to open on Thursday.
............................
POT, NEM, WYNN, CELG
Tuesday, July 22, 2008
InPlay for Short Term - July 24 Earnings
After shortlisting the companies for July 24 earnings play from the screen, here is what may be worth for further analysis:
1) Analyze Buying CALLs ATM or ITM for :
SII - Can't really figure what may be the best strategy. It is consolidating & will move in either direction, mostly upwards.
POT - Buy a PUT & a CALL for 220 Strike. After announcement, ride the wave in a direction & close the other. This is expected to swing big time. Exit in maximum 2 - 3 days or preferably the same day.
RTN - Can't figure out a clear strategy. However, our expectation is Bullish.
OXY - At 200 day MA Take no position. However, our expectation is Bullish.
NEM - Buy 50 dollar Call for September, instead of August.
WYNN - Buy 95 or 100 dollar CALL for September (preferably 95) . It broke thru its 50 day & 22 day SMAs.
2) Analyze Buying PUTs ATM or ITM for : CELG. Strategy will be to Buy a 75 dollar PUT for August
3) Buy Stock = F . Then Later on, if it moves upwards, Selling a near the money Covered Call.
.............
Analyzing July 24 Earnings Candidates
Analyzing Oil, Financials, & Earnings Game
BIDU announces earnings after market close.
300 Strike Price PUT seemed an attractive move in anticipation of the stock going down after the announcements.
......
OXY : Along the same lines OXY will announc earnings on July 24 & therefore the following seemed a good position for analysis.
Sell August 85 Strike, credit = 1.04
Buy November 75 Call, Debit = 9.04
Net Debit = 8.00
......
FNM : 1) Calendar Calls. Sell Dec 13 Call & Buy March 09 Calls for 0.55 debit.
2) Bull PUT Spread: Sell August 7 & Buy 5 for 0.20 for a $2 spread.
......
DUG : This trades inverse for the Oil. If Oil goes down, this goes up.
Analyze Buying Oct 30 Call & Selling August 37 Call for $1.32 debit
.....
XLE : Analyze Buying September 79 Put & Selling August 75 Put for $3.29 Debit
.....
IWM & RUT : These have been going up, however, there seem to be less reasons to
sustain this uptrend after earnings announcements expire.
Analyze IWM Buying September 70 PUT & Selling 67 PUT for $1.20 debit.
There are other similar PUT combinations that can also be analyzed.
.....
Monday, July 21, 2008
August
After being bruised by XOI & surviving some beating with XSP in July, there was great sigh of relief from XLF, C, FNM, & BAC.
Now, for August, the following new examples may seem to be worth for analysis & study:
Bear Call Spreads: IWM (73/74) ; SPY or XSP (130/131) ; XLF (23/24) ; SDS (77/78 or 77/79 or even higher combinations) ;
Bull Put Spreads: FNM (5/7) ; BAC (20/22.5) ; XLE (70/68) ; TWM (64/62)
The above are small risk spreads that may provide a decent rate of return with fixed/known risks & returns.
Based on the direction, a position on one side can be followed up with a condor in opposite direction in the future.
Of course, one needs to be aware that there is no real direction in the markets & it is driven by emotions. The technicians & experts can perform all the analysis, but all that analysis gets thrown out of the window in a market driven more by emotions.
................
Sunday, July 13, 2008
Still Afloat n Fishing ?
Oh well , are we still afloat. Given the volatility and the turmoil, it is best to stay on sidelines & settle existing positions.
However, there is a temptation to analyze the following low risk strategies that offer a good return & turn into a potential cash machine to sell positions every other month or every month.
1) FNM
BUY Jan 2010 Call , Strike = 5 ; Pay 7.05
Then either ride it or sell Short August 2008 Call, Strike 14 for credit of 2.00
2) XLF
BUY Jan 2010 Call , Strike = 10 ; Pay 9.20
Then either ride it or sell Short August 2008 Call, Strike 20 for credit of .90
........................................
Wednesday, July 2, 2008
IWM - Bull PUT Spreads
IWM trades at 1/10th of RUT ( Russell 2000 ).
Analyze a Bull PUT Spread
Buy July 61 PUT for .18
Sell July 63 PUT for .36 or .35
Credit = .18 or .17 for a 2 dollar spread.
Return about 8 - 9 % before commission for less than 3 weeks
This position enters risk should IWM fall all the way down to 63
............................
Analyze a Bull PUT Spread
Buy July 61 PUT for .18
Sell July 63 PUT for .36 or .35
Credit = .18 or .17 for a 2 dollar spread.
Return about 8 - 9 % before commission for less than 3 weeks
This position enters risk should IWM fall all the way down to 63
............................
Tuesday, July 1, 2008
Aug XSP
Sunday, June 29, 2008
What is on radar for week of June 30
Investigating USO, SWN, HAL, AUY, GLD, DBV, KOL, XLE, XSP, IWM , DIA as potential candidates for upcoming week.
USO, XLE, & KOL are great energy ETFs that may help in hedging against the energy crisis & can help in paying for additional amounts we pay at the pump for gasoline. Although oil appears to have been overbought, everyone is saying it is driven up by speculators, & is a bubble, but then it still continues to go up. The global political crisis does not seem to ease at the situation.
HAL & SWN - watching for a small pull back & then analyze taking up some positions.
AUY, GLD, DBV - Gold related positions & Currency baskets help in hedging in uncertain times.
XSP, IWM, DIA seem to be beaten down too much, but considering cautious positioning for 6 months ahead may provide good returns.
Markets are driven alot by emotions too, so who knows what lies ahead.
............................
Friday, June 27, 2008
VIX
VIX , a favorite one for diagonal spreads.
-Looking at buying December 18 Call and then selling a July 27.5 (or even 25) Call against it. Several combinations can be investigated.
-Percent return on the diagonals using VIX is quite good & the fact that there are several other months to trade, allows traders to make trading VIX into a cash generating machine as long as the Long Position Dec call is quite a bit in the money (ITM).
Wanna Swim against the current ? - IWM RUT DIA XSP
IWM - August BULL PUT Spread: Analyze to Buy 59 Put & Sell 62 Put for a credit of .35 for a 3 dollar spread for a 10 - 12% return if IWM stays above 62.
RUT - Analyze a position buying August 790 Call around 1.45 and wait for RUT to bounce so as to sell as call against it or merely sell it on rebound.
DIA - Holding a position in each, March 2009 114 Call AND Jan 2010 110 Call look attractive given the beating it is taking & expected rebound in future.
XSP - March 2009, 130 Call looks good too.
..........................
Thursday, June 26, 2008
XOI
For July
Buy 1350 PUT at 7.70
Sell 1360 PUT at 8.60
Credit = $.90 Margin/Spread = 10
Return for this example = .9/10 = 9% before commission
Buy 1350 PUT at 7.70
Sell 1360 PUT at 8.60
Credit = $.90 Margin/Spread = 10
Return for this example = .9/10 = 9% before commission
Tuesday, June 24, 2008
Few more for July
These are some good examples for July (see the picture).
Of course, the return in case of RUT may be low or the one for SPX may be too conservative. However, there is not much action, market is sideways, & not too much risk should be taken in summer months.
DUG may be something worthwhile with Oil supposed to pull back on pressure for correction. This thinking is a far fetched one but with a correction overdue. So, a deep in the money with almost 90% intrinsic value is being considered for the diagonal & still fetch a 10% on the SHORT position.
.................................
Friday, June 20, 2008
RUT - Bull PUT Spread
For July
Buy 650 PUT at 3.20
Sell 660 PUT at 4.20
Credit = $1
Margin/Spread = 10
Return for this example = 1/10 = 10% before commission
.........................
Buy 650 PUT at 3.20
Sell 660 PUT at 4.20
Credit = $1
Margin/Spread = 10
Return for this example = 1/10 = 10% before commission
.........................
Thursday, June 19, 2008
IRON CONDOR - RUT
Analyze the above Iron Condor example.
for this analysis, the diagram shows you the credits for each vertical spread, the Bear Call & the Bull Put credits.
For a 10 dollar spread, credit will be 1.35 which is a conservative 13.5% return.
If you trade 1 contract, the credit is 135 for 1000 of margin.
..............
IRON CONDOR - SPX
In this case, we combine both BULL PUT Credit & BEAR CALL Credit together
If you want to read about Bull Put or Bear Call credit spreads, read the other postings below.
Execution of trades can be done in several ways – bottom line is you will have 4 legs of trade.
You can exit from each side when either the Bull Put or Bear Call is making money or just let it expire. Key point is that we prefer the stock to trade between the SHORT positions.
In this example you make money & keep the credits from ea vertical trade.
Look at the diagram. If something goes wrong, it will go wrong for 1 side only, either SPX will go to right side or left side. So you simply close that one side position by buying back the short position you sold at or near the expiration. For such IRON Condor trade, you definitely keep the credit for 1 end or if it stays between the 2 Short sale positions, you keep the credit from both sides.
Max profit will be realized when SPX will remain between 1425 & 1245
Profit = .60 + .55 = 1.05
Margin = $5
So, % return will be 20%
If you trade 10 contracts, margin/risk=5K & Credit=1050/-
Similarly, for 5 contracts, margin/risk=2.5K & Credit=525/-
XSP Bull PUT Spread
Example of Bull PUT Spread for July 2008
Buy 121 PUT at .42
Sell 124 PUT for .65
Net credit = 23 cents
3 dollar spread. Return =8% if XSP stays above 124
Buy 121 PUT at .42
Sell 124 PUT for .65
Net credit = 23 cents
3 dollar spread. Return =8% if XSP stays above 124
Wednesday, June 18, 2008
BULL PUT CREDIT
High Level Concept:
1. Choose a stock or symbol that research indicates that it may remain steady & not go Down too much, implying that it is bullish. Or it is okay if it will be going up.
2. Then choose two strike price with a SPREAD of few dollars that is out of the money.
3. Then you BUY a PUT … the lower of the two strike prices.
4.Next, you SELL a PUT … the strike price is higher than what you bought.
5.You pocket the difference in the premium that you receive between the 2 strike prices … for each contract.
Example:
XOI is trading at 1540
You choose to BUY a PUT with Strike Price = 1400 & pay a premium of $13.20
This is a LONG position
Now, you Sell a PUT with Strike Price = 1410 & receive a premium of $14.70
This is a SHORT position
It is best to have both positions for same expiration month. In this example – July.
You pocket the difference in the premiums of $ 1.50 (this is the credit per share)
Note: Trading is conducted in contracts, each contract = 100 shares. Also, we will not take into account the commissions for both transactions, which are generally quite low (generally $25 for the entire trade).
If you buy & sell 10 contracts, you get a credit of $1.50 x1000 = 1500.00.
What happens at expiration:
If the stock remains above 1410, do nothing, you keep the credit received.
It is recommended that if it reaches very close to 1410 or the market is bearish, plus your research indicates that XOI will hit 1410 by expiration, then, monitor, & may be close the SHORT position. You do not want to be assigned the stock with a small loss.
Prior to getting into the position, conduct the research & analysis.
Margin, Risk, & Additional Notes:
Margin requirement is the difference between the strike prices times the # of shares. Here, it will be $10 per contract. For 10 contracts, it will be 10,000 dollars.
Maximum risk is the difference between the strike prices, less the net credit (difference in premiums).
This is a limited risk & limited income strategy.
You choose the right stock + the trend is bullish, as well as "Out Of The Money" (OTM).
A few words on what to choose?
Bottom line, investing in options is not for everyone & there are risks involved.
Options expire, you can lose the entire investment if the stock/ETF goes down substantially or crashes. Research & study details prior to investing in any form.
Do your homework, consult an expert &/or someone who is very familiar with investing in options.
Look into Index Options & E-Minis, especially that are liquid & settle in European style. You do not get assigned if it hits the strike price of the Short position.
XOI settles American style.
Friday, June 13, 2008
Bear Call Spreads
Bear Call Spread Strategy Summary
High Level Concept:
Example:
XLE is trading at 86
You choose to SELL a CALL with Strike Price = 90 & get a premium of $1.00
This is a SHORT position
Now, you BUY a CALL with Strike Price = 92 & it costs you a premium of $0.70
This is a LONG position
It is best to have both positions for same expiration month.
You pocket the difference in the premiums of $1.00 - $0.70 = $0.30 (this is the credit per share)
Note: Trading is conducted in contracts, each contract = 100 shares. Also, we will not take into account the commissions for both transactions, which are generally quite low (generally $25 for the entire trade).
If you buy & sell 10 contracts, you get a credit of $0.30x1000 = $300.00.
So in the above example for 10 contracts (1000 shares): Selling CALLs credits $1.00x1000 = $1000.00
Buying CALLs debits $0.70x1000= $700.00
Net Credit = 1000.00 – 700.00 = 300.00
What happens at expiration:
If the stock remains below 90, do nothing, you keep the $300.00
It is recommended that if it reaches very close to 90 or the market is bullish, plus your research indicates that XLE will hit 90 by expiration, then, monitor, & may be close the SHORT position. You do not want to be assigned the stock with a small loss.
Prior to getting into the position, conduct the research & analysis. We do not want or expect it to hit 90 in this case, else do not even enter into such a trade.
Margin, Risk, & Additional Notes:
Margin requirement is the difference between the strike prices times the # of shares.
The maximum profit is the net credit (difference in premiums). $500 in this example.
Maximum risk is the difference between the strike prices, less the net credit (difference in premiums). Here, maximum risk is $2000.
The above is calculated: 1000 shares x 2 spread = $2000 is your investment. Credit received = $300. So the worst case scenario is losing $2000 - $300 = $1700
You therefore receive a round figure 17% return w/o taking into account commissions. Or let us round off to 16% if you account for commissions. This is for duration of 40 - 60 days max. Not bad, if you can repeat & roll such strategy every month.
This is a limited risk & limited income strategy.
Your break-even point is the higher strike price (#1) minus the net credit.
In above example the break-even is at 90.00 + 0.30 = $90.30.
So you are not at a loss as long as the stock price remains below this number.
You choose the right stock + the trend is bearish, as well as "Out Of The Money" (OTM).
A few words on what to choose?
Here, in the example, we chose XLE. That is related to the Oil & Exploration industry, is an ETF. It is safer to choose ETFs or an equity in a strong industry (as in this example). Also, one point to note is that an ETF is not directly dependent on earnings calendar when compared to individual stocks which may get beaten up when earnings are reported. In simple words, choosing ETFs is comparatively safer.
Bottom line, investing in options is not for everyone & there are risks involved.
Options expire, you can lose the entire investment if the stock/ETF goes down substantially or crashes. Research & study details prior to investing in any form.
Do your homework, consult an expert &/or someone who is very familiar with investing in options.
Look into Index Options & E-Minis, especially that are liquid & settle in European style. You do not get assigned if it hits the strike price of the Short position.
Examples include – RUT, SPX, XSP, OEX, VIX, ….
High Level Concept:
Choose a stock or symbol that research indicates that it may remain steady & not go up, implying that it is NOT bullish. Or it is okay if it will be going down.
Then choose two strike price with a SPREAD of few dollars that is out of the money.
Then you SELL a CALL … the lower of the two strike prices.
Next, you BUY a CALL … the strike price is higher than what you sold.
You pocket the difference in the premium that you receive between the 2 strike prices … for each contract.
Example:
XLE is trading at 86
You choose to SELL a CALL with Strike Price = 90 & get a premium of $1.00
This is a SHORT position
Now, you BUY a CALL with Strike Price = 92 & it costs you a premium of $0.70
This is a LONG position
It is best to have both positions for same expiration month.
You pocket the difference in the premiums of $1.00 - $0.70 = $0.30 (this is the credit per share)
Note: Trading is conducted in contracts, each contract = 100 shares. Also, we will not take into account the commissions for both transactions, which are generally quite low (generally $25 for the entire trade).
If you buy & sell 10 contracts, you get a credit of $0.30x1000 = $300.00.
So in the above example for 10 contracts (1000 shares): Selling CALLs credits $1.00x1000 = $1000.00
Buying CALLs debits $0.70x1000= $700.00
Net Credit = 1000.00 – 700.00 = 300.00
What happens at expiration:
If the stock remains below 90, do nothing, you keep the $300.00
It is recommended that if it reaches very close to 90 or the market is bullish, plus your research indicates that XLE will hit 90 by expiration, then, monitor, & may be close the SHORT position. You do not want to be assigned the stock with a small loss.
Prior to getting into the position, conduct the research & analysis. We do not want or expect it to hit 90 in this case, else do not even enter into such a trade.
Margin, Risk, & Additional Notes:
Margin requirement is the difference between the strike prices times the # of shares.
The maximum profit is the net credit (difference in premiums). $500 in this example.
Maximum risk is the difference between the strike prices, less the net credit (difference in premiums). Here, maximum risk is $2000.
The above is calculated: 1000 shares x 2 spread = $2000 is your investment. Credit received = $300. So the worst case scenario is losing $2000 - $300 = $1700
You therefore receive a round figure 17% return w/o taking into account commissions. Or let us round off to 16% if you account for commissions. This is for duration of 40 - 60 days max. Not bad, if you can repeat & roll such strategy every month.
This is a limited risk & limited income strategy.
Your break-even point is the higher strike price (#1) minus the net credit.
In above example the break-even is at 90.00 + 0.30 = $90.30.
So you are not at a loss as long as the stock price remains below this number.
You choose the right stock + the trend is bearish, as well as "Out Of The Money" (OTM).
A few words on what to choose?
Here, in the example, we chose XLE. That is related to the Oil & Exploration industry, is an ETF. It is safer to choose ETFs or an equity in a strong industry (as in this example). Also, one point to note is that an ETF is not directly dependent on earnings calendar when compared to individual stocks which may get beaten up when earnings are reported. In simple words, choosing ETFs is comparatively safer.
Bottom line, investing in options is not for everyone & there are risks involved.
Options expire, you can lose the entire investment if the stock/ETF goes down substantially or crashes. Research & study details prior to investing in any form.
Do your homework, consult an expert &/or someone who is very familiar with investing in options.
Look into Index Options & E-Minis, especially that are liquid & settle in European style. You do not get assigned if it hits the strike price of the Short position.
Examples include – RUT, SPX, XSP, OEX, VIX, ….
Subscribe to:
Posts (Atom)